Aside from using monitoring to capture and review this data I can only think of the oplog as the source of information. That requires a replicaSet and an oplog adequately sized to cover your two day period.
use local
db.oplog.rs.aggregate([{$match: {
  ts: { $gt: Timestamp( 1601215288,0)},
  ns: "databaseOfInterest.collectionOfInterest"
}}, {$group: {
  _id: "$op",
  count: {"$sum": 1}
}}])
If you don’t have a replicaset then you may fall back on using an ObjectID if that is the type for _id. That will only give you documents that have been created though.
The first number is unix epoch, seconds since Jan 1 1970. The second is the order.
If multiple operations occur in the same second in the oplog they are ordered by the second number.
I generated the first number with the date command on ubuntu. date -d '2 days ago' +%s
I tried the command in linux box and i got the below output.
[mongodb@mongoxyz11 ~] date -d '2 days ago' +%s
1601288759
[mongodb@mongoxyz11 ~] date -d ‘1 days ago’ +%s
1601375172
[mongodb@mongoxyz11 ~]$ date -d ‘10 days ago’ +%s
1600597583
How do we know what should be the order for the second number? On what basis we can know on the second number?
Secondly I tried the script provided from your end and for one collection which as approx 12 million records, took almost one hour 45 min to provide the data.
Is there any better method to get the output, as fetching details from oplog might really take lot of time and might throw a performance issue.
For your purposes, 0. The 0th operation that occurred at that epoch second.
The oplog is a special collection. Not intended for this use, it will not be performant. If you intend to run a few queries like this consider making a copy and create some indexes.
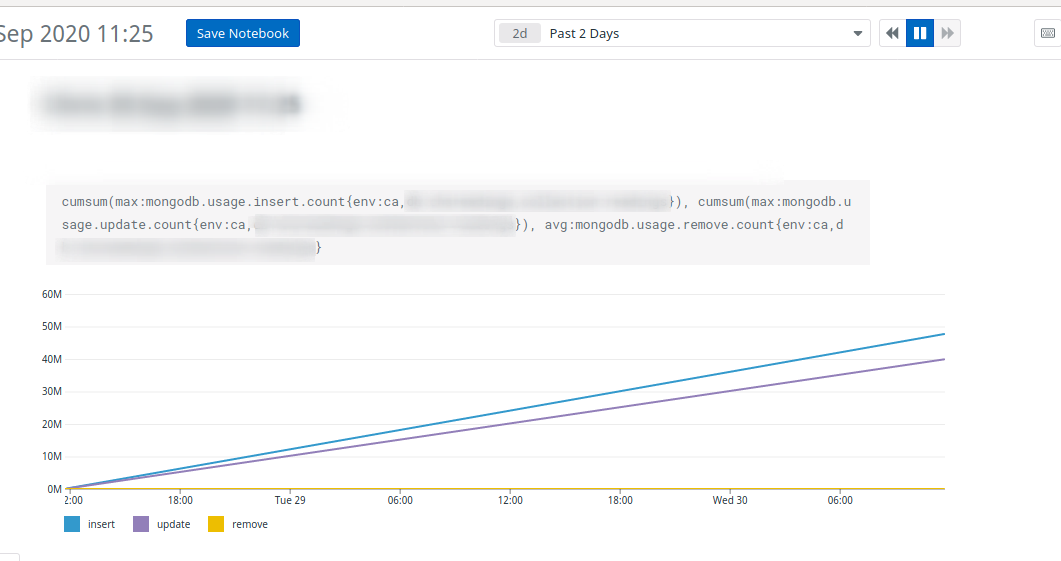
Add some instrumentation on your deployment if you want metrics like this. I use DataDog, it is trivial to get these data.