Hello,
We are having a pretty specific usecase of mongodb replication. There’s a very small set of data of around 1-2GB that is updated a lot at peak periods and gets replicated.
We use 3 sites:
site 1: PSA cluster, 2 data bearing voting members
site 2: Secondary replica, non voting, non electable, RTT from site 1 is 10ms
site 3: Secondary replica, non voting, non electable, RTT from site 1 is 100ms
The HW specs do not differ between sites 2 & 3:
6 CPU cores + 5 GB RAM. Performant SSD drives for data storage.
The oplog size is set to 10GB.
p002-rs:SECONDARY> rs.printReplicationInfo()
configured oplog size: 10240MB
log length start to end: 8533secs (2.37hrs)
oplog first event time: Tue Apr 20 2021 01:13:50 GMT+0000 (UTC)
oplog last event time: Tue Apr 20 2021 03:36:03 GMT+0000 (UTC)
now: Tue Apr 20 2021 03:36:04 GMT+0000 (UTC)
WriteConcern is not in use (since PSA arch is in effect).
The intention is to deliver frequently updating data without delays to sites 2 and 3 from site 1.
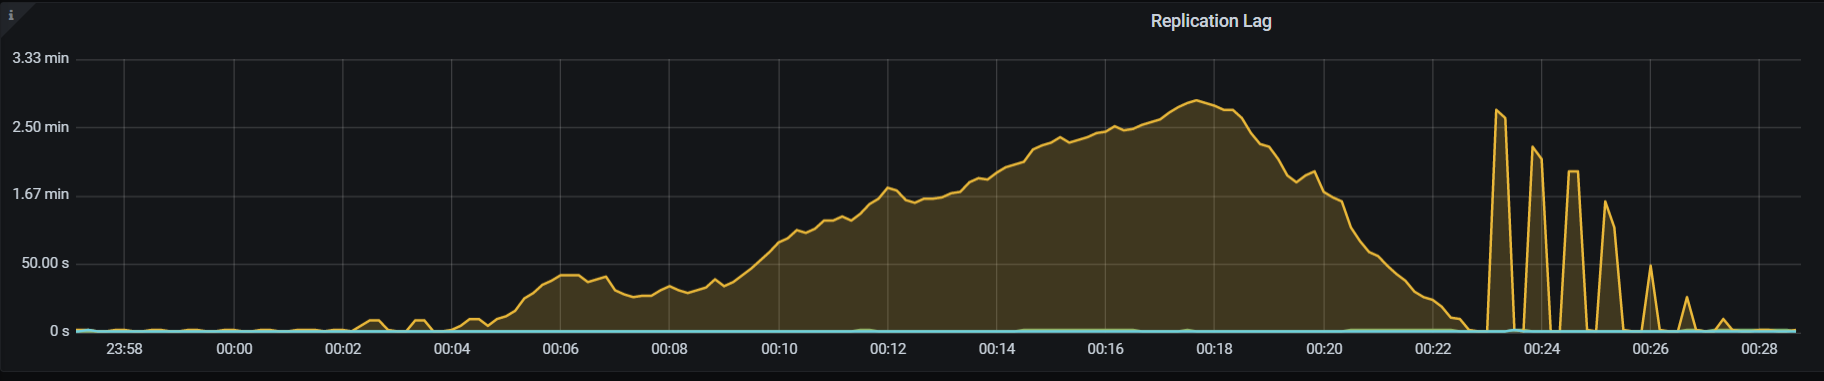
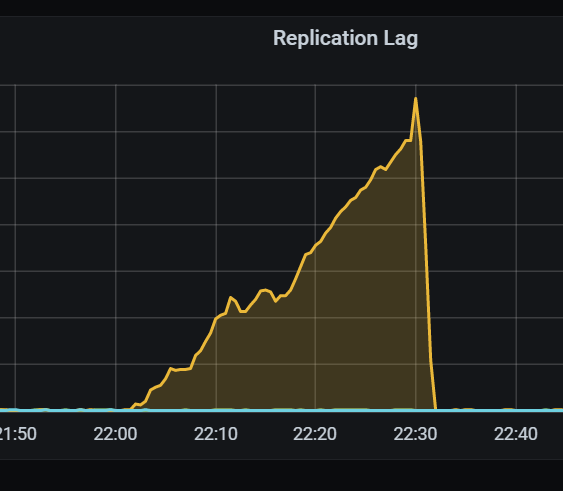
We observe no issues with site 2 whatsoever. But for site 3 a replication lag appears from time to time that may last up to 1 hour, continuously growing. At the very same time, there are absolutely no signs of troubles on site 2. Worth noting that site 2 instance is also actively serving requests at the same time, while site 3 is not very loaded by clients.
We face different cases and cannot reliably correlate it with load patterns. Sometimes with TPS reaching 8k ops there may be no lag at all, at other times with about 4k ops we observed the lag grow.
We investigated the effect of slow locking queries on Primary side and fixed them, so now the DB profiling does not produce any queries slower than 1s.
I would like to know how to understand the cause of the lag whilst it is increasing and piling up? Is there any common approach to apply to troubleshooting this?
Some cluster related details:
p002xdmn* - site 1
p002xdmg000 - site 2
p002xdmg200 - site 3
rs.conf:
p002-rs:SECONDARY> rs.conf()
{
		"_id" : "p002-rs",
		"version" : 15,
		"term" : 12,
		"protocolVersion" : NumberLong(1),
		"writeConcernMajorityJournalDefault" : true,
		"members" : [
				{
						"_id" : 0,
						"host" : "p002xdmn000:27017",
						"arbiterOnly" : false,
						"buildIndexes" : true,
						"hidden" : false,
						"priority" : 2,
						"tags" : {
						},
						"slaveDelay" : NumberLong(0),
						"votes" : 1
				},
				{
						"_id" : 1,
						"host" : "p002xdmn001:27017",
						"arbiterOnly" : false,
						"buildIndexes" : true,
						"hidden" : false,
						"priority" : 1,
						"tags" : {
						},
						"slaveDelay" : NumberLong(0),
						"votes" : 1
				},
				{
						"_id" : 2,
						"host" : "p002xdmn002:27017",
						"arbiterOnly" : true,
						"buildIndexes" : true,
						"hidden" : false,
						"priority" : 0,
						"tags" : {

						},
						"slaveDelay" : NumberLong(0),
						"votes" : 1
				},
				{
						"_id" : 5,
						"host" : "p002xdmg000:27017",
						"arbiterOnly" : false,
						"buildIndexes" : true,
						"hidden" : false,
						"priority" : 0,
						"tags" : {

						},
						"slaveDelay" : NumberLong(0),
						"votes" : 0
				},
				{
						"_id" : 7,
						"host" : "p002xdmg200:27017",
						"arbiterOnly" : false,
						"buildIndexes" : true,
						"hidden" : false,
						"priority" : 0,
						"tags" : {

						},
						"slaveDelay" : NumberLong(0),
						"votes" : 0
				}
		],
		"settings" : {
				"chainingAllowed" : true,
				"heartbeatIntervalMillis" : 2000,
				"heartbeatTimeoutSecs" : 10,
				"electionTimeoutMillis" : 10000,
				"catchUpTimeoutMillis" : -1,
				"catchUpTakeoverDelayMillis" : 30000,
				"getLastErrorModes" : {

				},
				"getLastErrorDefaults" : {
						"w" : 1,
						"wtimeout" : 0
				},
				"replicaSetId" : ObjectId("5e7888456f011b6b9bbbd2f1")
		}
}
rs.status:
p002-rs:SECONDARY> rs.status()
{
		"set" : "p002-rs",
		"date" : ISODate("2021-04-20T03:38:55.185Z"),
		"myState" : 2,
		"term" : NumberLong(12),
		"syncSourceHost" : "p002xdmn001:27017",
		"syncSourceId" : 1,
		"heartbeatIntervalMillis" : NumberLong(2000),
		"majorityVoteCount" : 2,
		"writeMajorityCount" : 2,
		"votingMembersCount" : 3,
		"writableVotingMembersCount" : 2,
		"optimes" : {
				"lastCommittedOpTime" : {
						"ts" : Timestamp(1618889935, 1650),
						"t" : NumberLong(12)
				},
				"lastCommittedWallTime" : ISODate("2021-04-20T03:38:55.111Z"),
				"readConcernMajorityOpTime" : {
						"ts" : Timestamp(1618889935, 1650),
						"t" : NumberLong(12)
				},
				"readConcernMajorityWallTime" : ISODate("2021-04-20T03:38:55.111Z"),
				"appliedOpTime" : {
						"ts" : Timestamp(1618889935, 1650),
						"t" : NumberLong(12)
				},
				"durableOpTime" : {
						"ts" : Timestamp(1618889935, 1650),
						"t" : NumberLong(12)
				},
				"lastAppliedWallTime" : ISODate("2021-04-20T03:38:55.111Z"),
				"lastDurableWallTime" : ISODate("2021-04-20T03:38:55.111Z")
		},
		"members" : [
				{
						"_id" : 0,
						"name" : "p002xdmn000:27017",
						"health" : 1,
						"state" : 1,
						"stateStr" : "PRIMARY",
						"uptime" : 171609,
						"optime" : {
								"ts" : Timestamp(1618889933, 1809),
								"t" : NumberLong(12)
						},
						"optimeDurable" : {
								"ts" : Timestamp(1618889933, 1809),
								"t" : NumberLong(12)
						},
						"optimeDate" : ISODate("2021-04-20T03:38:53Z"),
						"optimeDurableDate" : ISODate("2021-04-20T03:38:53Z"),
						"lastHeartbeat" : ISODate("2021-04-20T03:38:54.035Z"),
						"lastHeartbeatRecv" : ISODate("2021-04-20T03:38:54.696Z"),
						"pingMs" : NumberLong(11),
						"lastHeartbeatMessage" : "",
						"syncSourceHost" : "",
						"syncSourceId" : -1,
						"infoMessage" : "",
						"electionTime" : Timestamp(1617942386, 166),
						"electionDate" : ISODate("2021-04-09T04:26:26Z"),
						"configVersion" : 15,
						"configTerm" : 12
				},
				{
						"_id" : 1,
						"name" : "p002xdmn001:27017",
						"health" : 1,
						"state" : 2,
						"stateStr" : "SECONDARY",
						"uptime" : 171609,
						"optime" : {
								"ts" : Timestamp(1618889933, 1809),
								"t" : NumberLong(12)
						},
						"optimeDurable" : {
								"ts" : Timestamp(1618889933, 1809),
								"t" : NumberLong(12)
						},
						"optimeDate" : ISODate("2021-04-20T03:38:53Z"),
						"optimeDurableDate" : ISODate("2021-04-20T03:38:53Z"),
						"lastHeartbeat" : ISODate("2021-04-20T03:38:54.447Z"),
						"lastHeartbeatRecv" : ISODate("2021-04-20T03:38:54.312Z"),
						"pingMs" : NumberLong(11),
						"lastHeartbeatMessage" : "",
						"syncSourceHost" : "p002xdmn000:27017",
						"syncSourceId" : 0,
						"infoMessage" : "",
						"configVersion" : 15,
						"configTerm" : 12
				},
				{
						"_id" : 2,
						"name" : "p002xdmn002:27017",
						"health" : 1,
						"state" : 7,
						"stateStr" : "ARBITER",
						"uptime" : 171609,
						"lastHeartbeat" : ISODate("2021-04-20T03:38:54.471Z"),
						"lastHeartbeatRecv" : ISODate("2021-04-20T03:38:54.249Z"),
						"pingMs" : NumberLong(11),
						"lastHeartbeatMessage" : "",
						"syncSourceHost" : "",
						"syncSourceId" : -1,
						"infoMessage" : "",
						"configVersion" : 15,
						"configTerm" : 12
				},
				{
						"_id" : 5,
						"name" : "p002xdmg000:27017",
						"health" : 1,
						"state" : 2,
						"stateStr" : "SECONDARY",
						"uptime" : 171619,
						"optime" : {
								"ts" : Timestamp(1618889935, 1650),
								"t" : NumberLong(12)
						},
						"optimeDate" : ISODate("2021-04-20T03:38:55Z"),
						"syncSourceHost" : "p002xdmn001:27017",
						"syncSourceId" : 1,
						"infoMessage" : "",
						"configVersion" : 15,
						"configTerm" : 12,
						"self" : true,
						"lastHeartbeatMessage" : ""
				},
				{
						"_id" : 7,
						"name" : "p002xdmg200:27017",
						"health" : 1,
						"state" : 2,
						"stateStr" : "SECONDARY",
						"uptime" : 171608,
						"optime" : {
								"ts" : Timestamp(1618889933, 1809),
								"t" : NumberLong(12)
						},
						"optimeDurable" : {
								"ts" : Timestamp(1618889933, 1809),
								"t" : NumberLong(12)
						},
						"optimeDate" : ISODate("2021-04-20T03:38:53Z"),
						"optimeDurableDate" : ISODate("2021-04-20T03:38:53Z"),
						"lastHeartbeat" : ISODate("2021-04-20T03:38:54.251Z"),
						"lastHeartbeatRecv" : ISODate("2021-04-20T03:38:54.453Z"),
						"pingMs" : NumberLong(91),
						"lastHeartbeatMessage" : "",
						"syncSourceHost" : "p002xdmn001:27017",
						"syncSourceId" : 1,
						"infoMessage" : "",
						"configVersion" : 15,
						"configTerm" : 12
				}
		],
		"ok" : 1,
		"$clusterTime" : {
				"clusterTime" : Timestamp(1618889935, 1650),
				"signature" : {
						"hash" : BinData(0,"UCCI1C7YAqH3J4A0yw8lEYYudWk="),
						"keyId" : NumberLong("6906426962382684228")
				}
		},
		"operationTime" : Timestamp(1618889935, 1650)
}
A picture of the increasing lag from monitoring from the last occurrence: