I have an AWS EC2-hosted MongoDB Community Edition ReplicaSet consisting of a primary and 4 secondary replicas and a separate MongoDB Atlas cluster. The Op-Log for both is sized at 16GB. For Atlas, when I run rs.printReplicationInfo(), I see the following:
configured oplog size: 16999MB
log length start to end: 87384secs (24.27hrs)
oplog first event time: Wed Jun 17 2020 13:05:27 GMT-0400 (Eastern Daylight Time)
oplog last event time: Thu Jun 18 2020 13:21:51 GMT-0400 (Eastern Daylight Time)
now: Thu Jun 18 2020 13:21:51 GMT-0400 (Eastern Daylight Time)
For the AWS hosted ReplicaSet, I see:
configured oplog size: 16384MB
log length start to end: 1368secs (0.38hrs)
oplog first event time: Thu Jun 18 2020 12:58:50 GMT-0400 (Eastern Daylight Time)
oplog last event time: Thu Jun 18 2020 13:21:38 GMT-0400 (Eastern Daylight Time)
now: Thu Jun 18 2020 13:21:38 GMT-0400 (Eastern Daylight Time)
I’m curious as to why the log length for the AWS ReplicaSet Op-Log contains so much less activity than the Atlas hosted ReplicaSet. Any ideas? From what our Developers tell me, the Atlas instances should be experiencing a much higher rate of CRUD operations than the AWS instances. I’m fairly new to Mongo so ti doesn’t take much to baffle me, but this just seems weird.
The log length (or oplog duration) is based on the difference in times between the first and last events in the oplog.
I would start by asking your developers how they are measuring CRUD operations in each environment and ensure they are comparing similar metrics rather than an instinctive “prod should be busier”. There may be unexpected tasks or load testing running in your AWS environment.
If you are certain the CRUD workload is similar, a few possible differences to consider are:
bulk loading of data into your AWS deployment (for example, using mongorestore or mongoimport)
You could also try to compare differences in the oplog entries (grouping by operation type or namespace), but I would be cautious on doing so in a production environment. The oplog does not have (or support) secondary indexes, so arbitrary queries will result in a collection scan and possible performance impact.
For detailed querying & analysis I would dump and restore oplogs into a test environment.
I’ve confirmed with the Dev Team as well as the other DBAs that there are no mongorestore or mongoimport activities happening on the AWS-hosted instance. I’ve also confirmed that they are both on version 3.6.18. From an application logic perspective, there is no difference in code, apart from the connection string settings pointing to the two different SRV records.
When you say “grouping by operation type or namespace”, would you be willing to provide an example? As I said in my initial post, I’m fairly new to working with Mongo and have much to learn, so any info you might be willing to share would be greatly appreciated.
The replication oplog is a capped collection in the local database called oplog.rs. It can be queried like any other MongoDB collection, with the important caveat I noted earlier about not supporting secondary indexes. If you are using an Atlas shared tier deployment (M0, M2, M5) you will not have direct access to query the oplog, but since you mention a 16GB oplog that must be a dedicated cluster.
I asked how your developers are measuring CRUD operations because these sorts of insights are generally more straightforward using a monitoring tool which captures and plots activity metrics over time. For example, with your Atlas cluster you can look at charts like “Opcounters”, “Oplog GB/Hour”, and “Replication Oplog Window”. A significant change or difference in activity should be easier to spot visually and you can also configure alerts based on conditions.
If you don’t have a monitoring solution for your AWS deployment (or if you do, but don’t have comparable charts), I suggest trying MongoDB Cloud Manager. This provides similar charts & alerts to Atlas which should help identify variations between your deployment workloads. Another approach you can take is log forensics using something like mtools or Keyhole.
However, since your specific question is about oplog consumption the most definitive source of information will be the oplog data. The oplog format is generally considered internal for replication and the majority of users don’t dig into the details. You can find more context by peeking at the MongoDB source code on GitHub: db/repl/oplog_entry.idl describes the oplog format in MongoDB 3.6.
The oplog format varies slightly between versions of MongoDB but the general document format looks like:
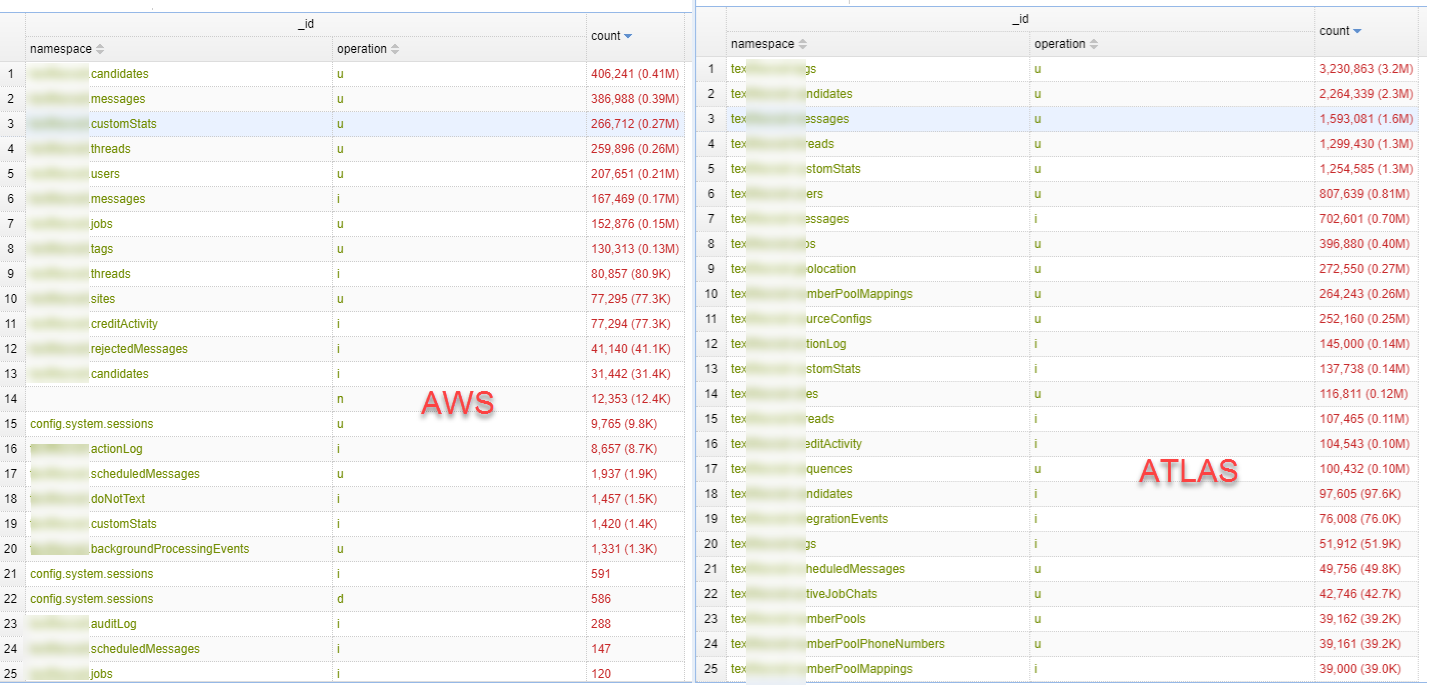
Most of these fields are only interesting for internal replication, but for your specific question you might want to aggregate across a few dimensions like namespace and operation (I renamed these fields in my aggregation grouping for clarity):
For the oplog period covered in this output, you can see there was:
one session created ( config.system.sessions)
several documents inserted into test.foo and test.bar (i => insert operation)
one document deleted from test.foo (d => delete operation). An update operation would be u.
several data commands (c => command) which would include creating new collections and indexes
a number of no/op commands on an empty namespace (n => no-op). If a replica set does not have any other write activity, every 10 seconds a small “no-op” entry will be written. This keeps the operation time advancing so it is clear when a secondary is behind because no recent writes have been received versus being behind in applying oplog entries.
If you have a largely idle replica set, the no-op entries will likely have the highest count but not be an interesting difference in terms of oplog duration (a more active deployment will have larger document writes instead of no-ops).
Given your description of equivalent versions with quite different oplog durations, my guess is that you have a higher number of insert/update/delete operations than expected or the content of those operations is different between environments (for example, you are using retryable writes on AWS or a different driver version).
This query was very helpful, so thank you very much for that. In looking at the query’s output, I still see the Atlas instance having a much larger count of CRUD operations when compared to the AWS-hosted instance, so I’m confused as to why with the same 16GB oplog sizing, the AWS-hosted instance still has a much shorter oplog duration. Any other ideas?
Hello,
This might sound like a trivial question, but i just want to clarify as i cannot think of anything else.
Is it possible that the AWS cluster is actually built/instantiated on Thu Jun 18 2020 12:58:50 GMT-0400 (Eastern Daylight Time)?
The AWS-hosted instance has been around for over a year. The only reason that this is being brought up is that we had a hardware issue that necessitated rebuilding a secondary node in another data center in another region, and when doing the initial sync for that new node, we ran into issues where the oplog was cycling over preventing the reseed to complete.
As far as I can see from looking at the oplog data, and in speaking with the developers, the type of data and size of each insert/update being written is roughly the same. The amount of operations is different, as I mentioned above. The Atlas instance is receiving a much greater number of operations.