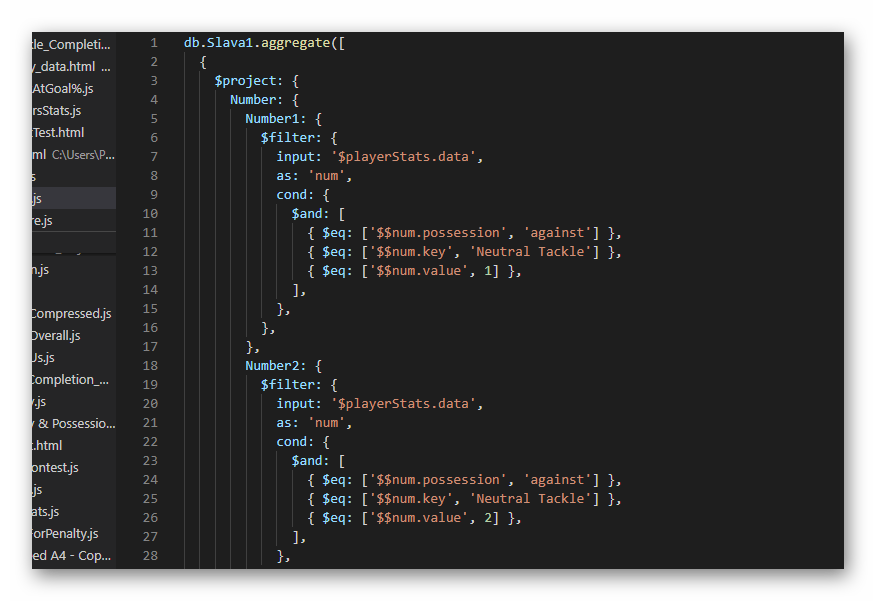
Hi. I am trying to set up charts using an aggregation. My question is how do i apply a filter on a document if the project stage only outputs the new fields I created. I use certain fields in the pipeline and even if I carry them through to the end it doesn’t seem that the filter applies to within the pipeline. I want to apply the filter to a field that is present in the original document and then want it to change the result of the aggregation. Below i will attach a pic of the aggregation as well as my data setup. So i am trying to see all the stats that each individual player performed which is listed under the value key. Later i then want to be able to filter on the value and that should then exclude certain player numbers.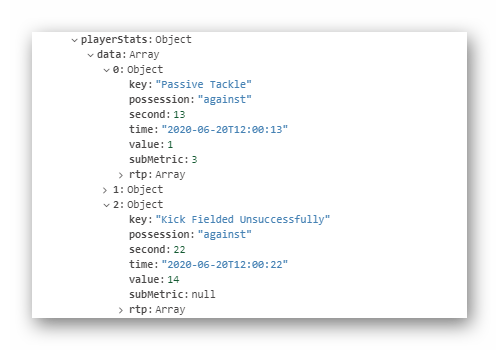
Hello, @johan_potgieter!
Provide a readable javascript object (or array of objects), that you want to have as a result of your aggregation.
I want to be able to filter all the documents on a specific field that occurs within the documents but want to apply the filter with the javascript sdk. So at the moment i can filter the documents to a specif team name because only some of the documents contain that name. But I want to be able to create a filter that can be applied to values that occur all the documents after i run an aggregation. It is difficult to explain. So basically i want to output something like area with A,B,C,D and then be able to filter on that area.
Sometimes few small visual examples better than 1000 words ![]()
Better provide:
- prettified document example from your collection. You can get it with db.your_collection.findOne();
- example javascript object, that would show, how you want to transform your existing document
Hi @johan_potgieter -
I think you’ve already figured out a lot of this, but you may want to look at this article which explains how Charts builds its aggregation pipelines: https://docs.mongodb.com/charts/saas/aggregation-pipeline-generation/
Your challenge is that the your embedded charts can only influence the pipeline at a specific point (#4 in the list). So anything that you want to filter on must be set up in one of the preceding stages, e.g. a chart query or data source pipeline. Since those cannot be parameterised, you may not be able to solve your problem but I’m not sure I fully understand the scenario.
Tom
This topic was automatically closed 5 days after the last reply. New replies are no longer allowed.