Hi,
I have a 3 node mongodb replica set cluster, with one node handles write requests and two others handle read requests.
I have also a Spring Boot web server (with Spring Data MongoDB 3.0.6.REALEASE and mongodb-driver-sycn:4.0.5 java), which exposes a simple READ operation over a collection:
db.myCollectionName.aggregate([{ "$sample" : { "size" : 100}}, { "$project" : { "myFieldName" : 1, "_id" : 0}}])
This operation use $sample operator to randomly select 100 documents over a collection having about 100m documents, and project one field.
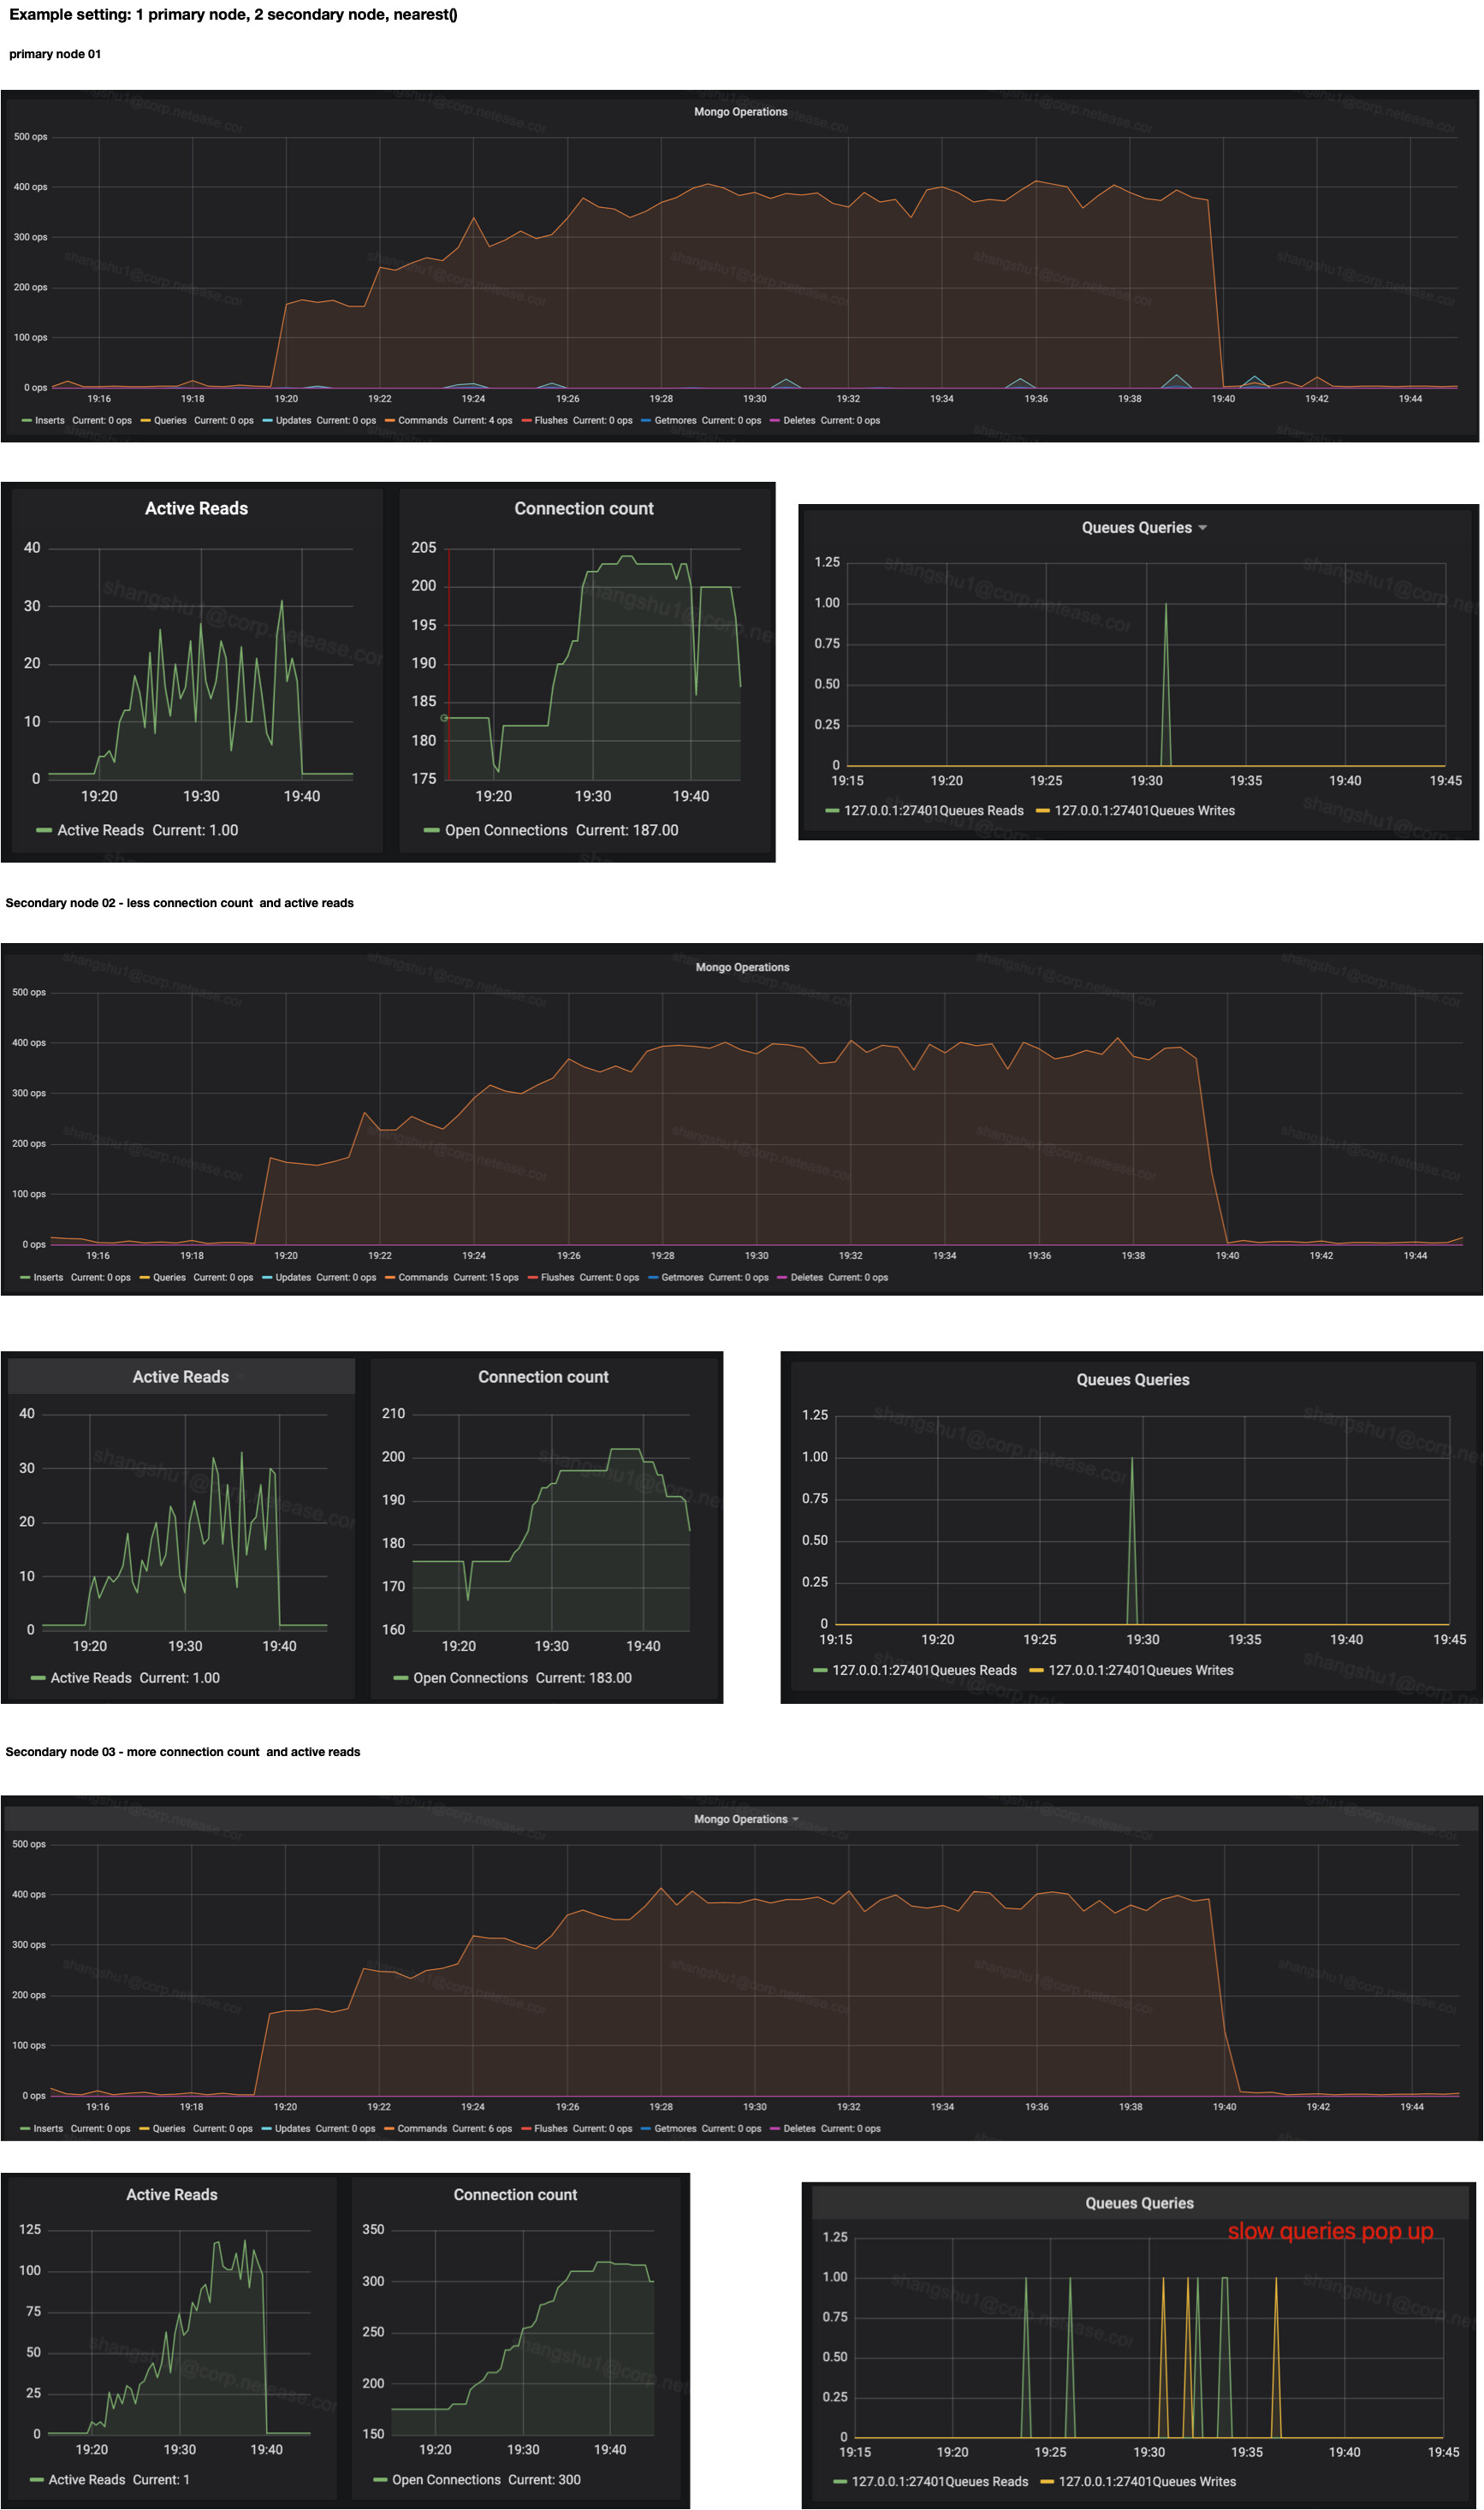
I use JMeter to do pressure test over the application, with ReadPreference.secondaryPrefererd() configured, it turns out that each secondary node can handle about 600 ops. However, the strange thing is:
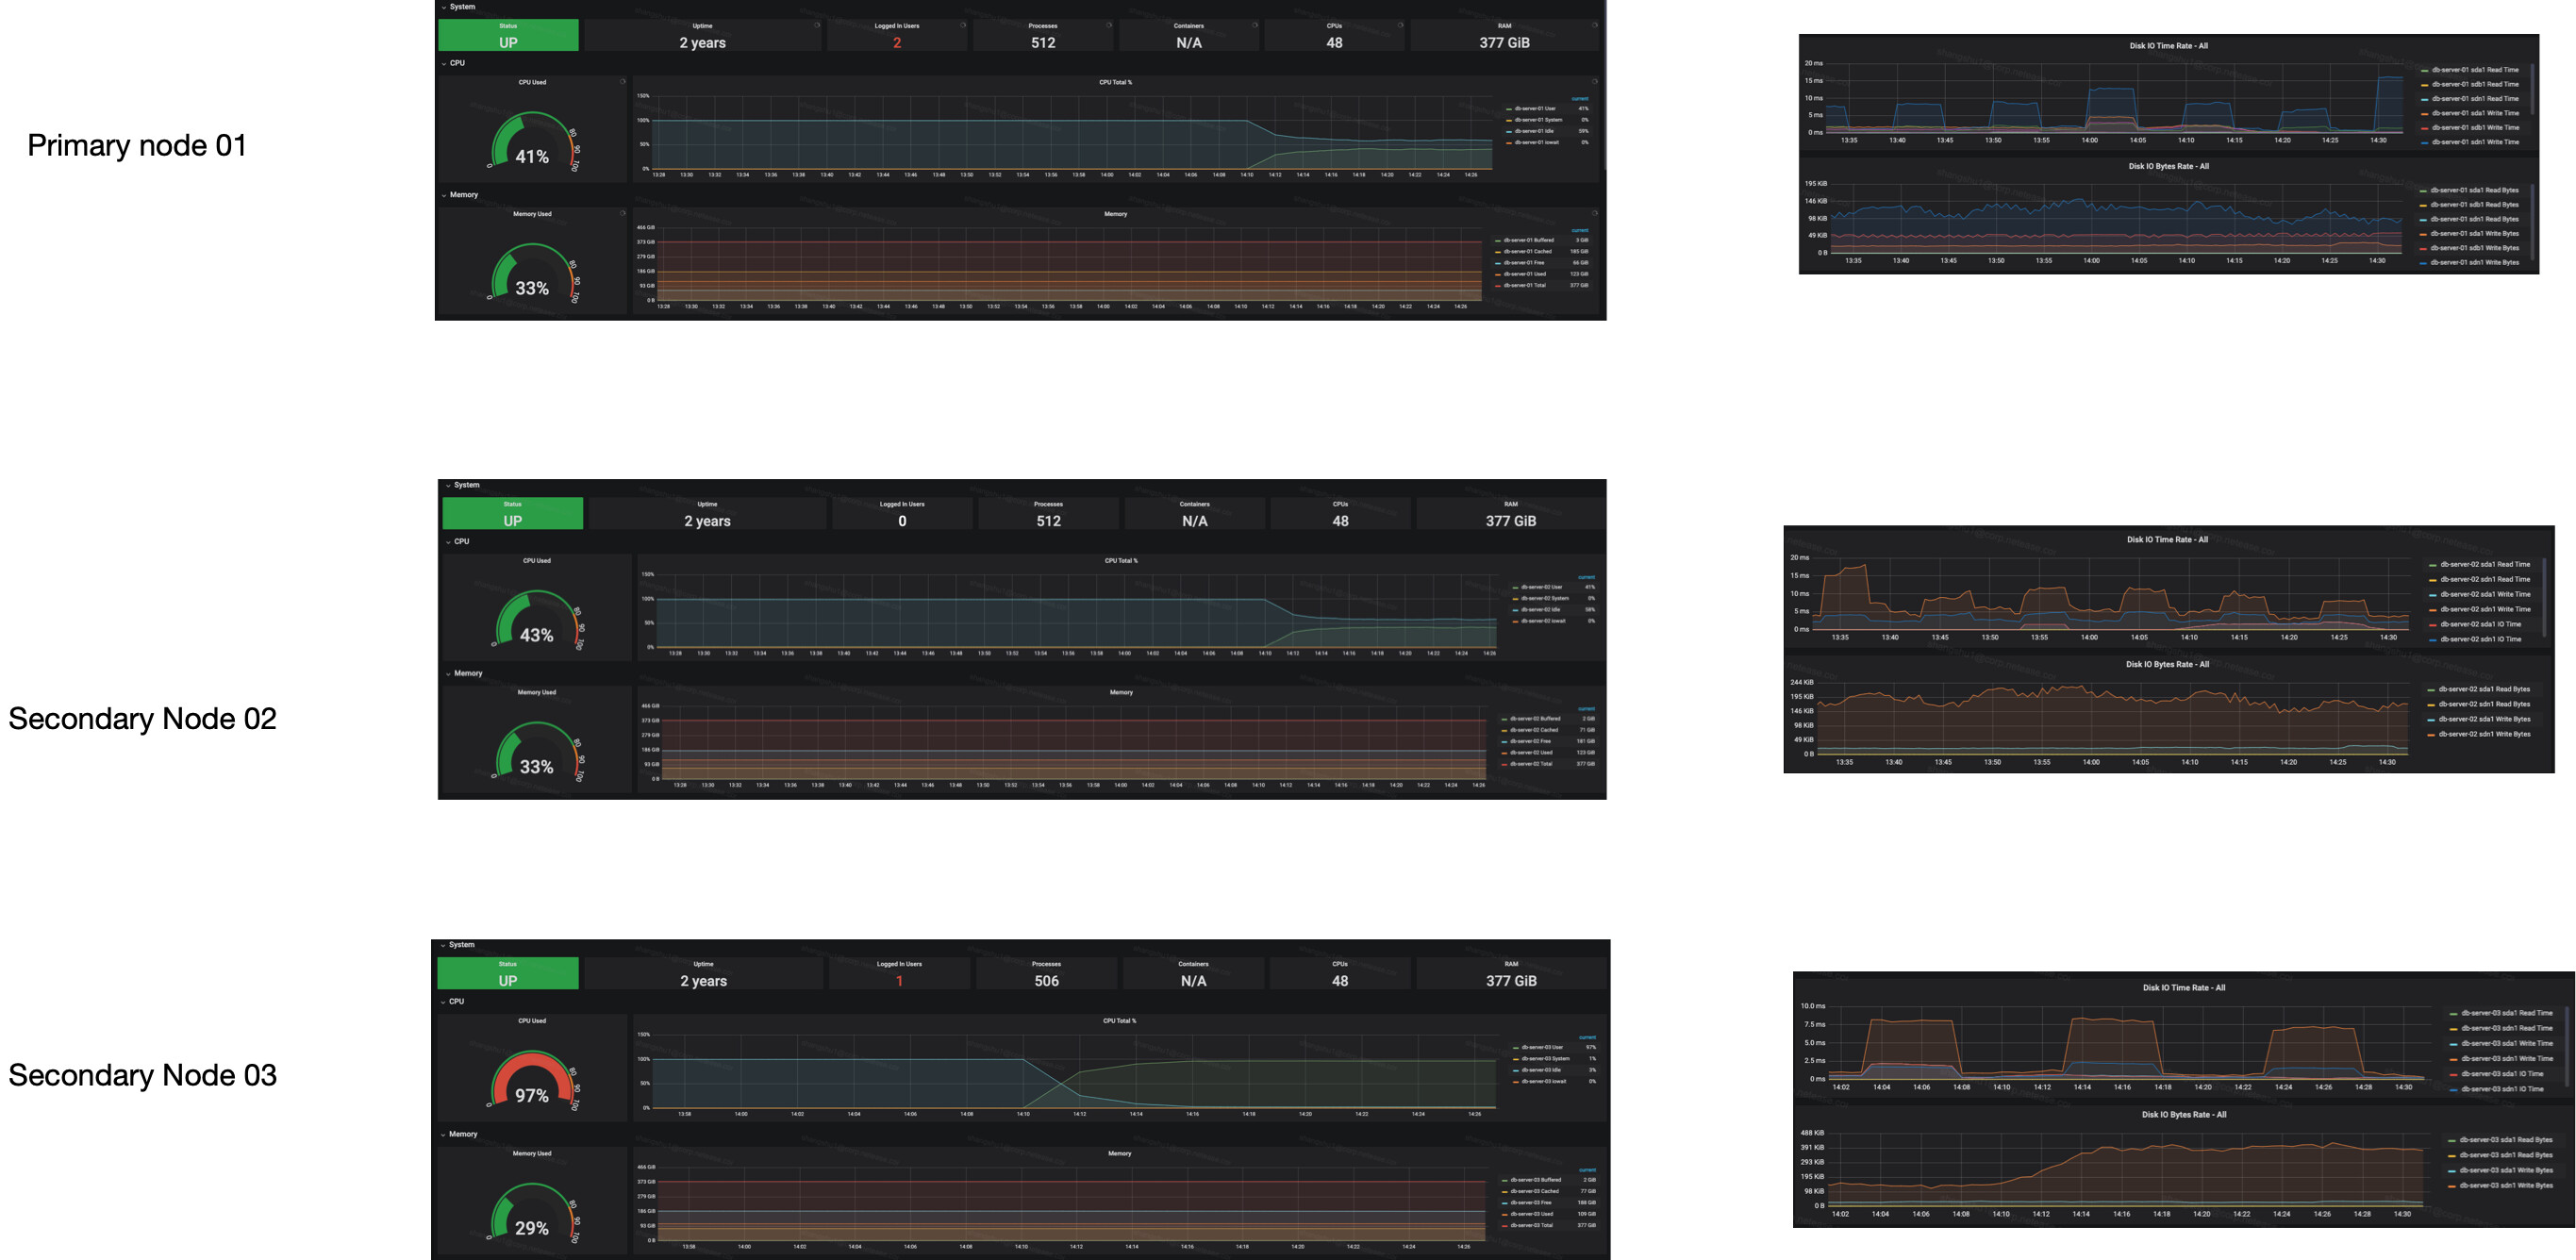
One secondary node has 100 more connection count over another, whereas can only handles the same #Ops. The node which bears less connection count also has much less active reads.
We can always repeat this problem if we try to retest more times.
Each secondary node has exactly the same software configuration and hardware setting.
Can anyone give some tips ?
BTW, I notice there is a server selecting algorithm: specifications/server-selection.rst at master · mongodb/specifications · GitHub
I tried to increase localThresholdMS however it does not work.